If you’ve always dreamed of running your own business, and if the smell of coffee brewing in the morning (or the afternoon, or at night) has always been one of your favorite aromas, we might have a career path for you. Before you dive head-first into the investment details, let’s consider demand.
You know people love coffee, but do you know just how much? How many people drink coffee? How much do we drink each day? How many cups do people buy at coffeehouses? We’ve got a few eye-opening coffee statistics for you right here.
U.S. Coffee Consumption
- Fifty percent of American adults drink coffee daily. That’s roughly 150 million people over the age of 18, some of whom are really putting in some effort, as collectively we’re downing about 400 million cups of coffee, or 3.1 cups each, on the daily.
- Coffee made its way to New Amsterdam, now known as New York City, in the mid-1600s. We were still mostly tea-drinkers, until a small protest known as the Boston Tea Party in 1773, when Americans’ preference for coffee was forever cinched.
- Coffee is the third-most-popular beverage in the world, beating out wine, vodka, and orange juice but losing to water and tea.
- Almost 60 percent of coffee drinkers hit up a U.S. coffee shop chain at least monthly in 2018.
- Forty percent of American coffee drinkers add milk or sweeteners to coffee, with 4 percent using a dairy alternative.
- Two-thirds of us prefer the convenience of the drive-thru when purchasing our coffee from a chain, according to Project Café USA 2021.
Sources: E-Imports, National Coffee Association, Haley’s Daily Blog, Beverage Daily, Urban Bean Coffee, World Coffee Portal
Types of Coffee Drinks
If you don’t know your latte from your cappuccino, here’s a little primer for you.
Americano (long black). Espresso diluted with hot water.
Breve. Equal parts espresso and steamed half-and-half.
Café au lait. It’s equal parts coffee and steamed milk.
Cold brew. Sweeter, smoother, and less acidic than regular coffee, according to the Eating Bird Food blog, cold brew is made by steeping coarse grounds in room temperature or cold water for 12 to 24 hours. It is never heated.
Cappuccino. Equal parts espresso, steamed milk, and foam. Typical size is six ounces.
Espresso. A dense coffee beverage prepared under high pressure in about 30 seconds on an espresso machine. It’s more finely ground than coffee and has a higher coffee-to-water ratio than regular coffee. Typical size is .08-1.2 fluid ounces, according to Urban Bean Coffee.
Flat white. Two-thirds espresso, one-third foamed milk.
Latte. This popular drink is one-third espresso, two-thirds steamed milk, and topped with foam. It can be customized with flavored syrups.
Mocha. Similar to a latte, but since it has chocolate syrup or cocoa powder in it, it gets its own designation.
Sources: Urban Bean Coffee, The Pioneer Woman, Tea Coffee Cup, Eating Bird Food
More coffee statistics to sip on
- The National Coffee Association says coffee is the second-most sought-after commodity in the world, just behind crude oil.
- The origins of coffee drinking date back to the 6th century, thanks to some wide-awake goats who wouldn’t sleep after consuming coffee berries (and some curious monks who brewed them into a beverage).
- In 2020–2021, people across the globe consumed 166.63 million 60-kilogram bags of coffee, an increase of over 164 million bags the previous year.
- Coffee is cultivated in more than 70 countries worldwide.
- The average 8-ounce cup of coffee has 95 milligrams of caffeine. The FDA recommends no more than 400 milligrams of caffeine daily.
Sources: National Coffee Association, Statista, USDA, FDA
Consider a Scooter’s Coffee franchise
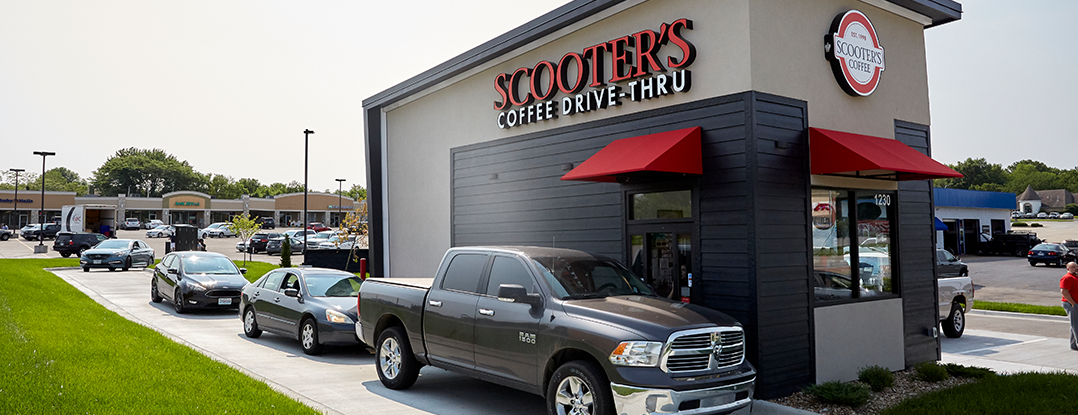
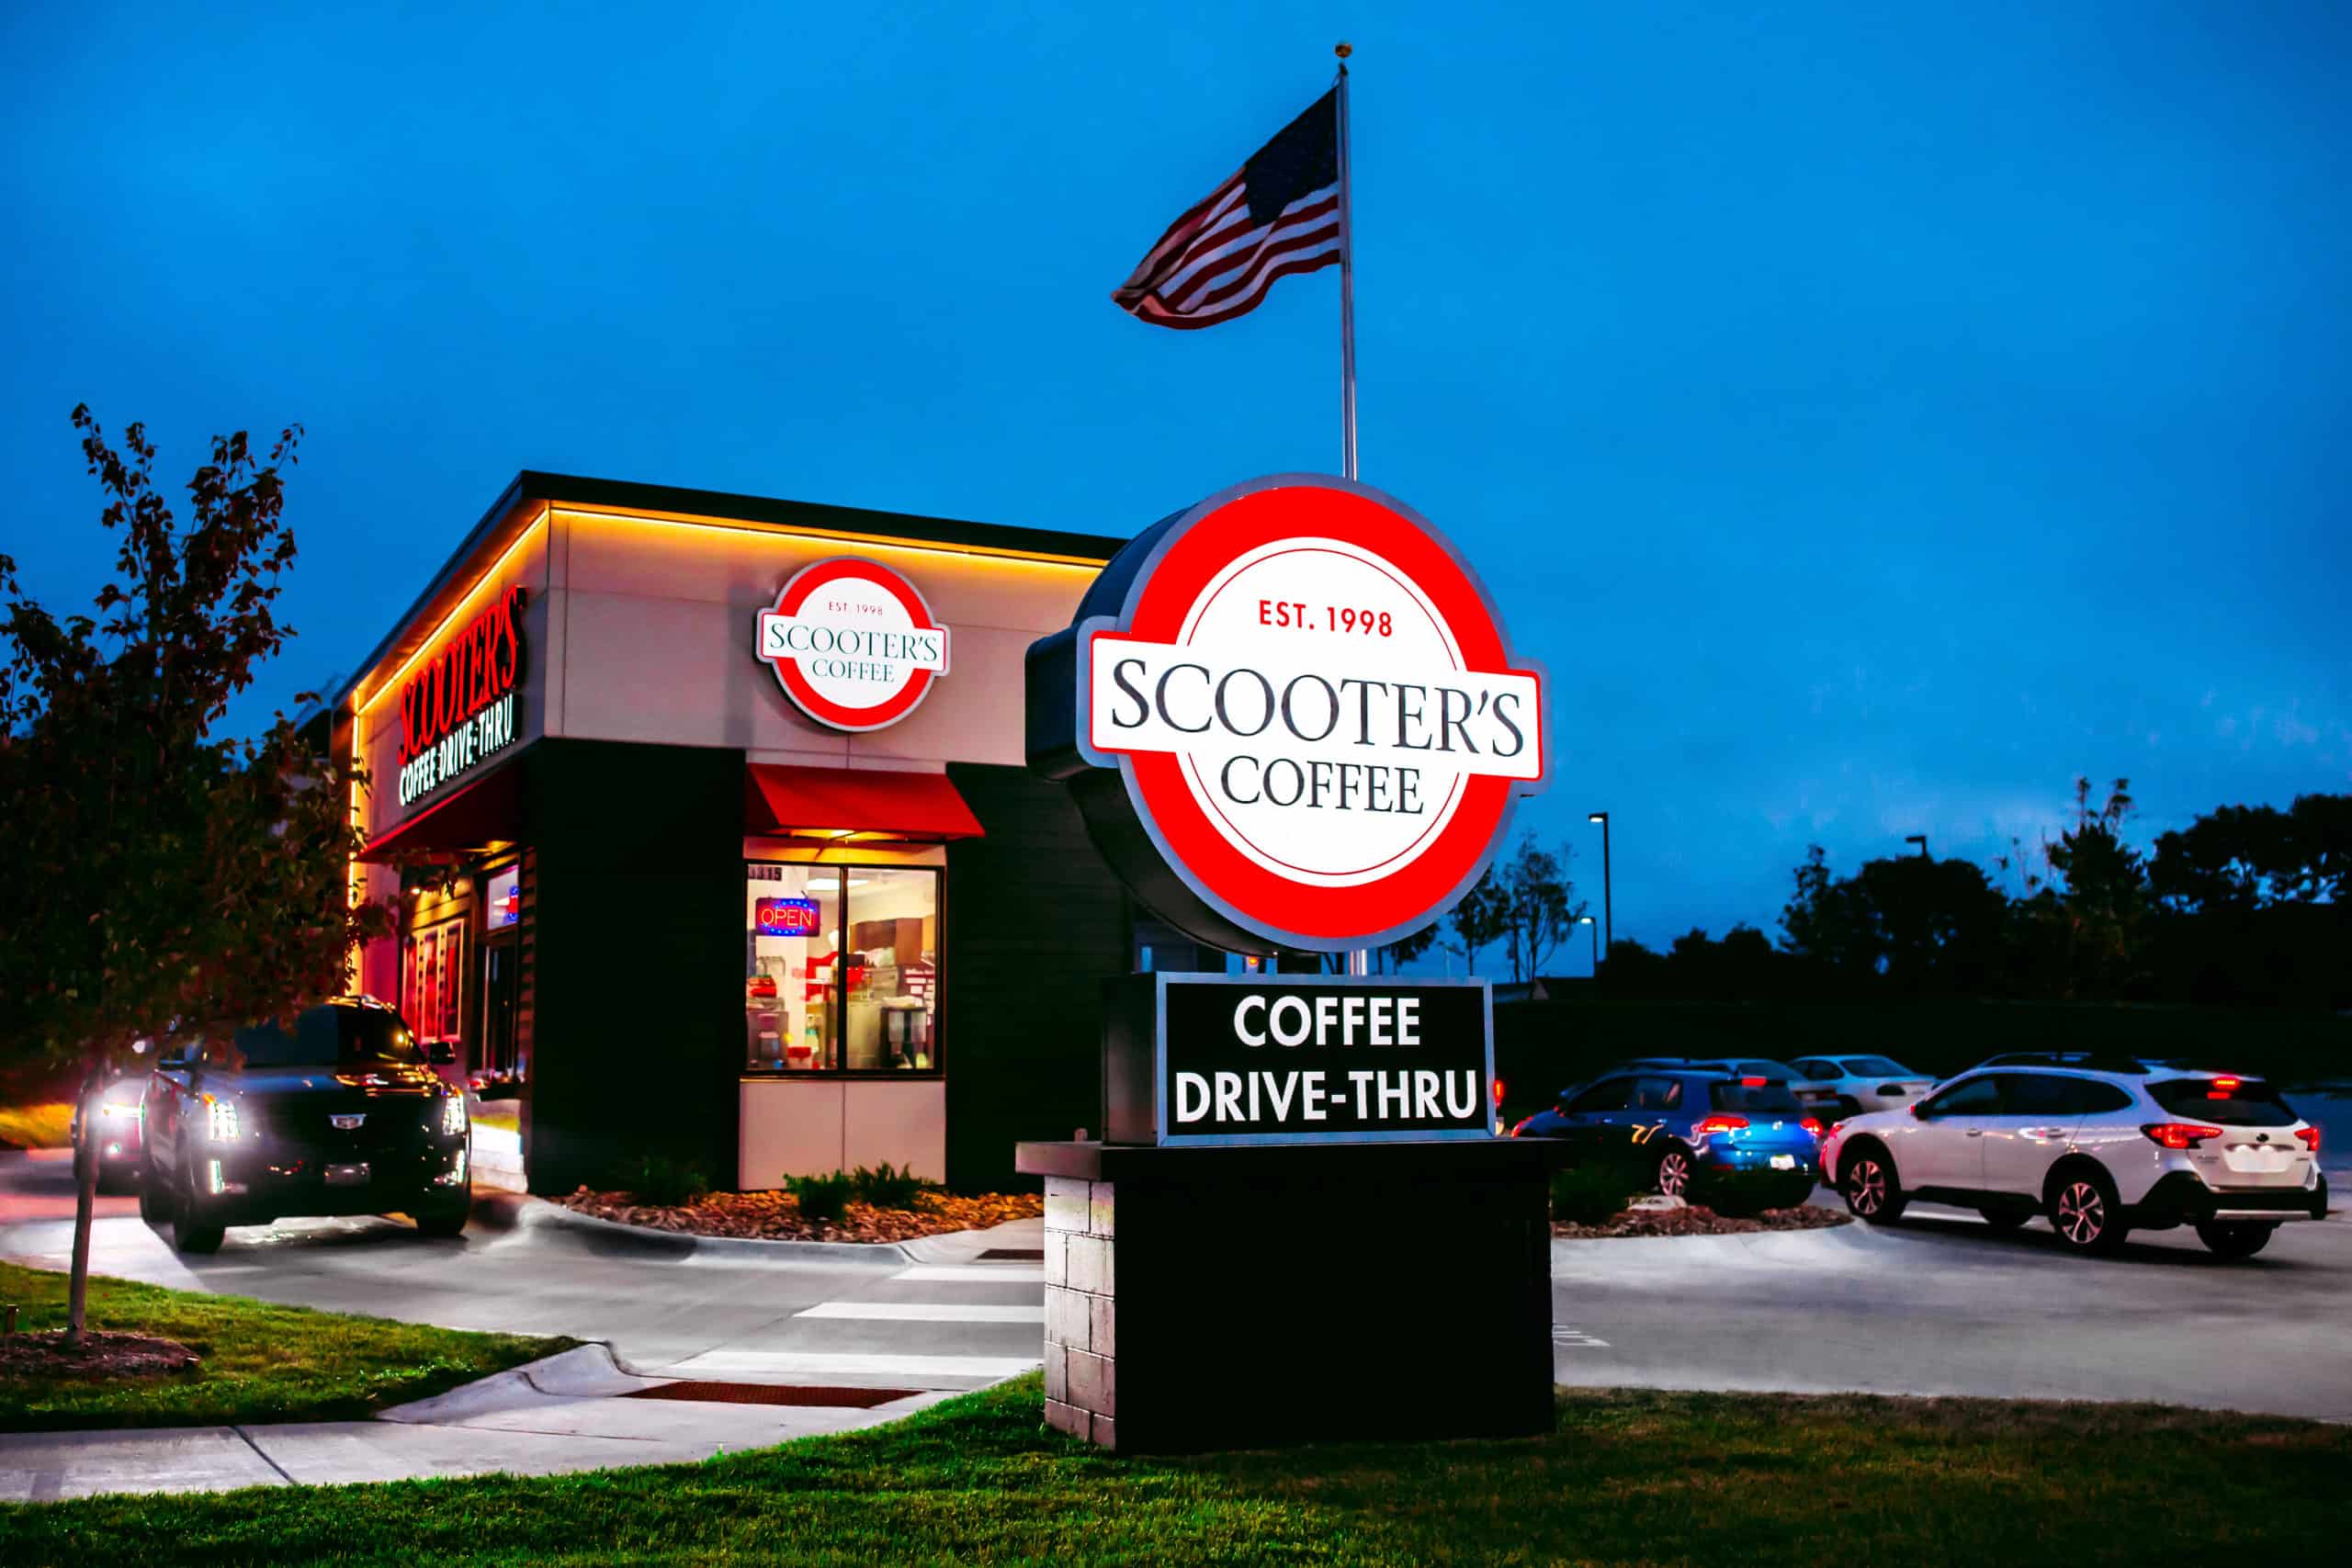
Last few coffee statistics (we promise): With an AUV of $993,790 and 24 percent year-over-year same-store sales growth, Scooter’s Coffee® is the fastest-growing drive-thru coffee franchise in the country.* We’ve been franchising since 1998, and we’re continuing to expand our coffee empire. To understand the business opportunity, request more information here. One of our franchise development representatives will be in touch.
*This is historical representation of what some of our franchisees have earned as described further in Item 19 of the FDD. This information is based upon the top 31 of 126 Drive-Thru Kiosks that were open during the entire 2020 calendar year and provided complete information. Of these 31 Drive-Thru Kiosks that compile the top quartile: (1) 13 of them (or 42%) had an AUV that met or exceeded $993,790, (2) 13 of them (or 42%) had a Net Profit Margin that met or exceeded the average. and (3) 15 of them (or 48%) had an EBITDA that met or exceeded the average. Your results may differ. There is no assurance that you will sell or earn as much. See Item 19 of the FDD for more information.

